Social Usage analysis of NTIA · United States
Social-network use by recorded sex
What do the Male and Female categories in NTIA’s survey tell us—and what remains unknown?
Data: November 2023 · Analysis checked: 2026-10-06
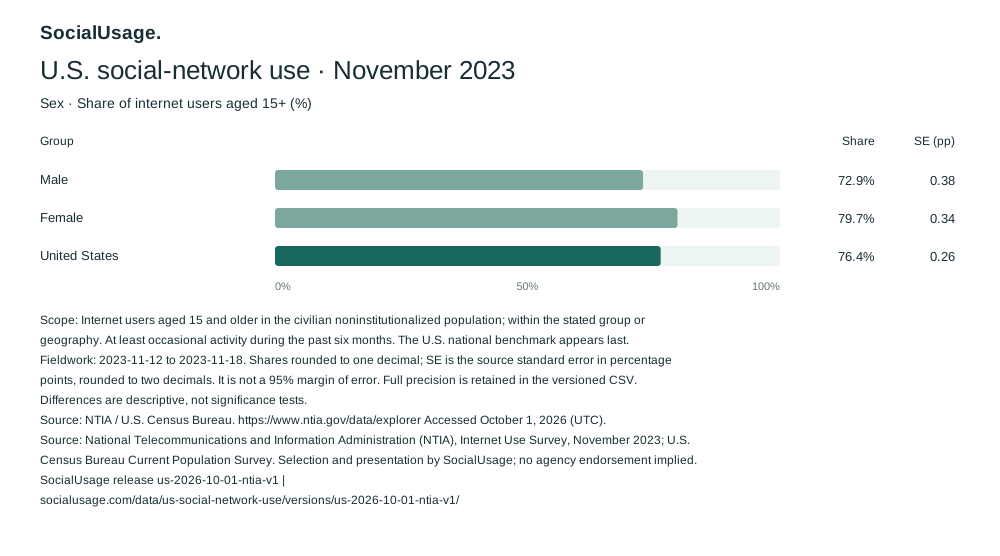
separate NTIA’s two source categories: 79.7% for Female and 72.9% for Male internet users aged 15+ were reported as using social networks at least occasionally during the prior six months.
People · U.S. civilian noninstitutionalized population · Internet users aged 15+ within each source sex category · November 2023
Source: NTIA Analyze Table, Nov 2023 / socialNetworkUser / adultInternetUser, sexFemale and sexMale columns. The percentage-point difference is Social Usage analysis of the full-precision estimates. It is not a significance finding or a measure of gender identity.
Two groups, the same activity question
These estimates ask whether people use social networks at least occasionally. They do not measure daily activity, time spent or use of a particular platform.
U.S. internet users aged 15+ · November 2023 · Prior six months
Source: NTIA Analyze Table, Male and Female Prop / PropSE columns, retained row 769. Original Social Usage graphic. Source standard errors: Male 0.3837 and Female 0.3420 percentage points. Source errors describe sampling uncertainty, not every possible survey error.
View exact percentages and source standard errors
| Source category | Share (%) | Source SE (pp) |
|---|---|---|
| Male | 72.8779 | 0.3837 |
| Female | 79.7063 | 0.3420 |
Source: fixed NTIA release and definitions. Proportions and their standard errors are each multiplied by 100. Standard errors are not margins of error or confidence intervals.
The separate national estimate is 76.4%, with source SE 0.2645 percentage points. It is the published weighted national estimate, not a simple average of the two group percentages. Inspect the national observation →
Keep the source’s sex categories intact
NTIA’s published breakdown uses Male and Female. Its supporting code takes the Census CPS variable PESEX and recodes it into those two labels. We retain that classification rather than describe the values as a survey of gender identities.
Source: official November 2023 tabulation code, retained line 43, PESEX recode; NTIA source category labels.
Inspect category coding and missing values
- The official code maps PESEX = 1 to the Male category.
- The official code maps PESEX = 2 to the Female category.
- The official code maps PESEX = −1 to missing, not to either category.
The selected evidence does not establish the exact wording or response circumstances of the original sex question, so this page does not label it sex assigned at birth or assume each person self-reported it. The social-network activity question separately allows household proxy responses.
Category coding: PESEX recode, line 43. Activity response context: questionnaire, PDF page 148.
If you are looking for “social media use by gender,” the distinction matters. These aggregates do not provide separate transgender, nonbinary or other gender-identity estimates. Their absence from this table is not evidence of zero use, and this two-category breakdown cannot establish how those populations were represented.
Participation within a group is not the makeup of an audience
The Female estimate means that about 79.7% of internet users aged 15+ in that source category were reported as using social networks. It does not mean 79.7% of all social-network users belonged to that category. Each group has its own denominator; the two percentages should not be added to make 100%.
The estimates also exclude people who do not use the internet. They cannot stand for all U.S. adults, all residents, or an adult-only population: the cutoff is 15, not 18.
The 6.8-point difference is a descriptive comparison at one time. These published cells do not adjust for age, income or other characteristics, identify why participation differs, or measure change over time. No sex-by-age, sex-by-state or sex-by-platform intersection is supplied in this selected table.
We retain each estimate’s source standard error but calculate no gap confidence interval or significance test. The marginal cells do not supply the full joint sampling information for an error calculation of the difference.
Source population, question and marginal cells: fixed NTIA release. Subtraction and interpretation are Social Usage analysis, not a source-reported causal finding.
Follow the comparison back to the source
Exact calculation, inputs and rounding
79.7063 − 72.8779 = 6.8284 percentage points, displayed as 6.8. Subtract the full-precision percentages before rounding. This is a difference between groups, not percent growth.
- Find
Nov 2023 / socialNetworkUser / adultInternetUserin the original NTIA aggregate CSV. Retained row 769 includes the header; a later file may put it elsewhere. - Read
sexFemalePropandsexMaleProp; multiply each by 100. Their corresponding*PropSEvalues are source standard errors and also require multiplication by 100. - Subtract the Male point estimate from the Female point estimate. Keep the common period, question and internet-user eligibility with both group-specific denominators.
| Category | Observation ID | Original columns |
|---|---|---|
| Male | US:2023:sex:sexMale | sexMaleProp / sexMalePropSE |
| Female | US:2023:sex:sexFemale | sexFemaleProp / sexFemalePropSE |
Source release: us-2026-10-01-ntia-v1. Analysis: ntia-sex-2026-10-06-v1; derivation: female-minus-male. Original source, code, question evidence and calculation inputs are bound to the assisted review.
Question, population and survey methods
The activity sequence asks about online activities done at least occasionally during the past six months. The SOCIAL question is: “What about using social networks, such as Facebook, Twitter, or Instagram?” Facebook, Twitter and Instagram are examples, not individual-platform estimates.
One randomly selected internet user aged 15+ per household; skip the activity questions when every internet user is under 15. A household member may answer on behalf of the selected person. NTIA publishes weighted estimates and standard errors from the U.S. Census Bureau Current Population Survey supplement; this report uses those aggregates and processes no individual responses.
Exact item and group sample sizes are not supplied in this selected aggregate record. Nonresponse, reporting, imputation and coverage errors can remain even where a standard error is small.
Source: November 2023 technical documentation, PDF page 148 / Attachment 8, questionnaire page 6; official tabulation code.
Dates and assisted review
- Fieldwork
- 12–18 November 2023
- Source-table publication
- 2024-06-06
- Retained source retrieval
- 2026-10-01 (UTC)
- Classification and questionnaire retrieval
- 2026-10-01 (UTC)
- Analysis checked
- 2026-10-06 · Assisted evidence and calculation review
This report reuses an immutable source and retained official evidence. It does not refresh the data period, claim a current-year estimate or imply independent human editorial approval.
Reuse and source credit
Selected federal aggregate facts and original Social Usage presentations retain their recorded reuse basis. The fixed exports keep source, population, data period, standard errors and version. No source graphic, agency logo or respondent data is copied.
U.S. federal statistical work; 17 U.S.C. § 105. Original rights verification: 2026-10-01. Source: National Telecommunications and Information Administration (NTIA), Internet Use Survey, November 2023; U.S. Census Bureau Current Population Survey. Selection and presentation by SocialUsage; no agency endorsement implied.
Inspect the fixed data
Source: National Telecommunications and Information Administration (NTIA), Internet Use Survey, November 2023; U.S. Census Bureau Current Population Survey. Selection and presentation by SocialUsage; no agency endorsement implied. These exports describe November 2023, including when cited later.