Social Usage analysis of NTIA / U.S. Census Bureau
How social-network use varies by educational attainment
Four education groups. A shared question, with limits that matter.
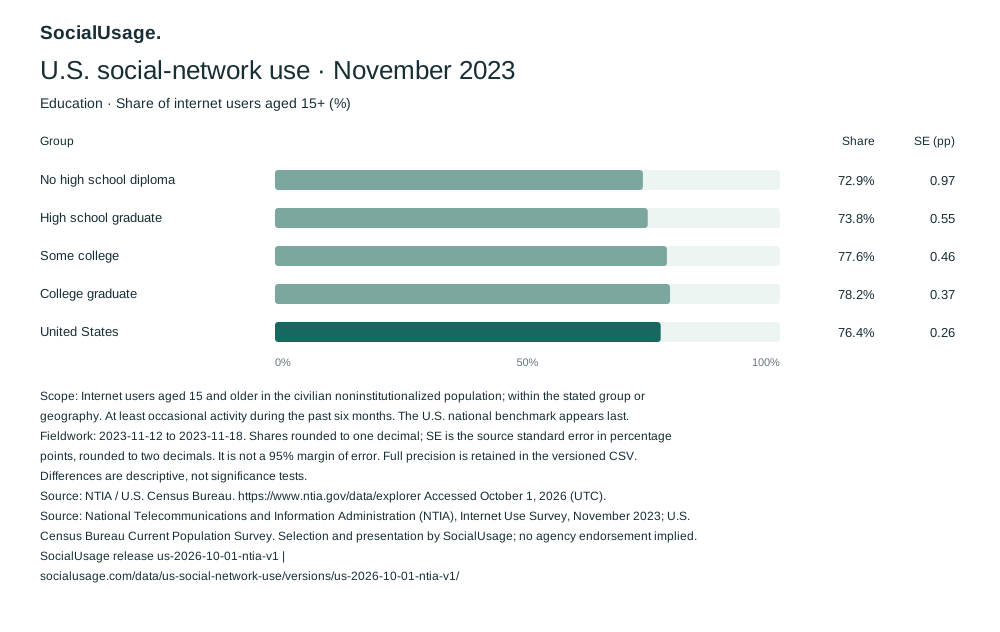
separate the reported social-network-use shares for college graduates and people with no high school diploma: 78.2% and 72.9%, respectively.
United States · Internet users aged 15+ within each education group · November 2023 · Activity in the prior six months
Source: NTIA Internet Use Survey, administered by the U.S. Census Bureau. Social Usage subtracts the full-precision percentages before rounding. This descriptive gap is not an estimated effect of education or a significance finding.
The four published education groups
Each bar describes people who use the internet within that attainment group. It does not describe all people with that education, current college students or an individual platform's audience.
Source: NTIA / U.S. Census Bureau, Analyze Table, Nov 2023 / socialNetworkUser / adultInternetUser; four education-group columns. Labels are rounded to one decimal. Full precision and source standard errors are below.
Read the data and source standard errors
| Education group | Share (%) | Standard error (pp) |
|---|---|---|
| No high school diploma | 72.8516 | 0.9671 |
| High school graduate | 73.8122 | 0.5500 |
| Some college | 77.6071 | 0.4598 |
| College graduate | 78.2265 | 0.3738 |
Source: NTIA aggregate CSV, row 769 including the header in the retained file; codes Nov 2023 / socialNetworkUser / adultInternetUser. Multiply each source proportion and its standard error by 100. These errors are not 95% margins of error or standard errors of the calculated differences.
The separately published national estimate is 76.4% of U.S. internet users aged 15+, with source standard error 0.2645 percentage points. It is a weighted national estimate, not an average of the four education percentages. Source and definition →
Attainment is not student status
Educational attainment of internet users aged 15+. High school includes GED; some college includes associate degrees and vocational study short of a bachelor’s degree. The source's college-graduate category covers a college degree or more. “Some college” is a broad category, not a count of people currently enrolled in college.
The age cutoff also matters. These estimates include internet users from age 15, so the no-diploma group can include people who have not yet reached the usual graduation age. This table provides no age-by-education breakdown that would let us separate them. It must not be relabelled a comparison of adults who completed or dropped out of school.
The two postsecondary groups have reported shares of 77.6% for some college and 78.2% for college graduates. Their descriptive difference is 0.6 percentage points. That small observed gap is not evidence of equality, a significant difference or an educational effect.
People who do not use the internet are outside every denominator here. Age, income and other characteristics may differ across the groups; these published percentages do not adjust for those differences. They cannot establish whether additional education changes social-network use.
Definitions: retained NTIA release and official November 2023 classification code, PEEDUCA recode. Percentages: NTIA Analyze Table. Both subtractions and interpretation are Social Usage's analysis.
Reproduce the comparison
Exact inputs, calculations and rounding
The endpoint difference is 78.2265 − 72.8516 = 5.3749 percentage points. The postsecondary comparison is 78.2265 − 77.6071 = 0.6194 percentage points. Each answer is rounded after subtraction; subtracting the displayed bar labels loses precision. These are differences between groups at one time, not percent growth.
- Find
dataset=Nov 2023,variable=socialNetworkUseranduniverse=adultInternetUserin the NTIA Analyze Table CSV. The retained row is 769 including the header; later files may use a different row number. - Read the selected
*Propcolumns below and multiply by 100 to obtain percentages. Read the matching*PropSEcolumns for source standard errors in percentage points. - Subtract the no-diploma or some-college percentage from the college-graduate percentage, then round the result for display.
- Keep the source population, category definitions, November 2023 period and six-month question with the citation.
| Group | Observation ID | Source columns |
|---|---|---|
| College graduate | US:2023:education:edCollegeGrad | edCollegeGradProp / edCollegeGradPropSE |
| No high school diploma | US:2023:education:edNoDiploma | edNoDiplomaProp / edNoDiplomaPropSE |
| Some college | US:2023:education:edSomeCollege | edSomeCollegeProp / edSomeCollegePropSE |
Fixed source release: us-2026-10-01-ntia-v1. Analysis: ntia-education-2026-10-05-v1; derivations: ntia-2023-education-endpoint-gap ntia-2023-education-postsecondary-gap . Exact source values, scope, category evidence and calculation inputs are bound to the analysis review.
Source categories, question and uncertainty
The retained official tabulation code groups PEEDUCA codes 31–38 as no diploma, 39 as high school diploma, 40–42 as some college or associate degree, and remaining nonmissing higher categories as college degree or more. Preserve the original grouping; it does not identify current enrollment, a specific course, field of study or an education-by-age intersection.
The survey sequence concerns activities done online at least occasionally in the past six months. Its social-network question is: “What about using social networks, such as Facebook, Twitter, or Instagram?” Platform examples do not provide individual-platform estimates.
One randomly selected internet user aged 15+ per household; skip the activity questions when every internet user is under 15. Proxy responses are allowed. These are NTIA's weighted aggregates from the Census Bureau Current Population Survey supplement; this report processes no individual responses.
Source standard errors accompany the individual percentages. We do not calculate a confidence interval or standard error for either gap, test significance or adjust for demographic differences. The marginal cells do not supply the covariance information needed for a full variance calculation of the differences. Sampling errors also exclude some reporting, nonresponse, proxy-response, imputation and other survey errors.
Official November 2023 tabulation code, retained line 42 (PEEDUCA recode). Technical documentation, PDF page 148 / Attachment 8, questionnaire page 6 (USEINT / SOCIAL); fieldwork on PDF page 7. Table code and dictionary.
Separate dates, assisted review and reuse
- Survey fieldwork
- 12–18 November 2023
- Source-table publication
- 6 June 2024
- Retained source retrieval
- 1 October 2026 (UTC)
- Analysis checked
- 5 October 2026 · Assisted evidence, category and calculation review
This analysis reuses the reviewed immutable source release and retained official classification code. It is not a new source fetch, a 2026 usage statistic or an independent human editorial review. One data period is used; there is no education trend here.
Reuse covers the selected original federal aggregates and attributed Social Usage presentations under the recorded source basis. Existing fixed CSV/SVG/chart-table links preserve source, population, period, uncertainty and version. No copied source graphic, agency logo or respondent data is included.
U.S. federal statistical work; 17 U.S.C. § 105 · Sources and rights. Source: National Telecommunications and Information Administration (NTIA), Internet Use Survey, November 2023; U.S. Census Bureau Current Population Survey. Selection and presentation by SocialUsage; no agency endorsement implied.
Inspect or reuse the source data
Use a fixed, attributed version when citing or reusing the chart. The explorer offers other supported breakdowns as separate views.