Social Usage analysis of NTIA / U.S. Census Bureau
How to read social-network use by race and Hispanic origin
Six source categories. Read the population and the classification before comparing percentages.
is the range of reported social-network-use shares across NTIA's six race and Hispanic-origin categories. Each percentage describes internet users within that group, rather than the group's share of all social-network users.
United States · Internet users aged 15+ in each group · November 2023 · Activity in the prior six months
Source: NTIA Internet Use Survey, administered by the U.S. Census Bureau. Range selected by Social Usage from the six published point estimates. Sampling errors differ; this range does not establish significant differences or a definitive group ranking.
The six published groups, in source order
The Hispanic category includes people of any race. Every other category excludes Hispanic respondents. Keep these complete labels when quoting a percentage.
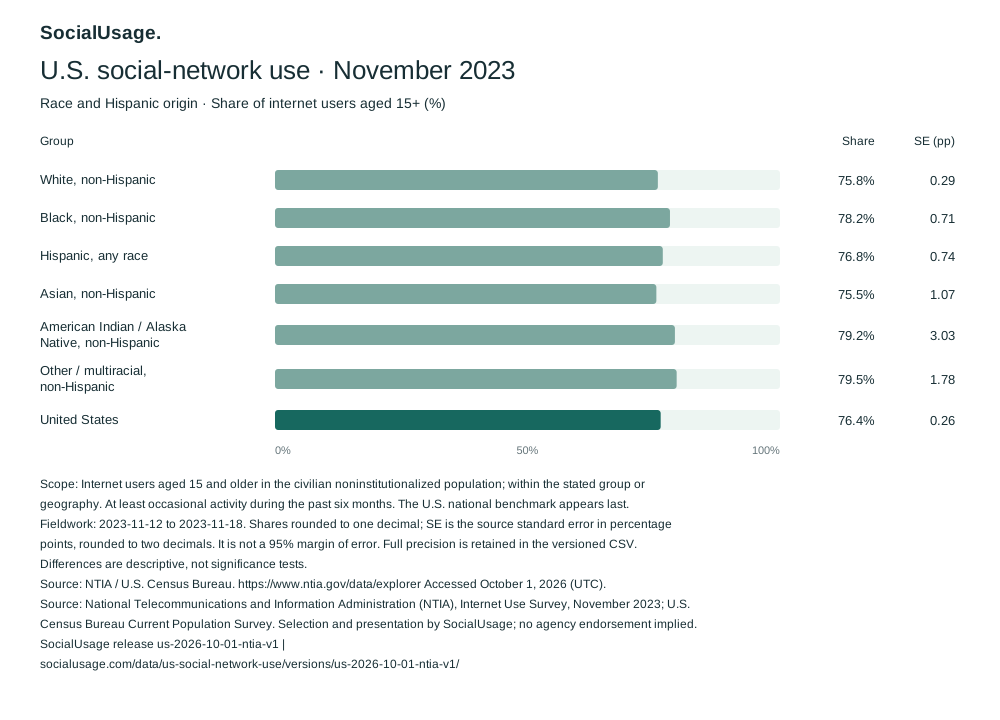
Source: NTIA / U.S. Census Bureau, Analyze Table, Nov 2023 / socialNetworkUser / adultInternetUser; race-group columns. One-decimal labels; full precision and source standard errors below. This chart retains category order and does not sort the estimates into a ranking.
Read all six estimates and their source standard errors
| Source group | Share (%) | Standard error (pp) |
|---|---|---|
| White, non-Hispanic | 75.8144 | 0.2865 |
| Black, non-Hispanic | 78.2131 | 0.7095 |
| Hispanic, any race | 76.7909 | 0.7418 |
| Asian, non-Hispanic | 75.5168 | 1.0676 |
| American Indian / Alaska Native, non-Hispanic | 79.1919 | 3.0266 |
| Other / multiracial, non-Hispanic | 79.5382 | 1.7830 |
Source: NTIA aggregate CSV, retained row 769 including the header; Nov 2023 / socialNetworkUser / adultInternetUser. Multiply each proportion and its SE by 100. These source SEs are not confidence intervals, margins of error or the error of a difference.
The separate national estimate is 76.4%, with source SE 0.2645 percentage points. It is a weighted estimate, not an unweighted average of these six percentages. National source and definition →
Hispanic origin is applied across races
The Hispanic category includes any race. The separate Hispanic-origin indicator assigns these respondents to the Hispanic group after the race recode. A Hispanic respondent is therefore not also counted in one of the non-Hispanic categories in this published breakdown.
The White, Black, Asian and American Indian / Alaska Native categories exclude Hispanic respondents after that reassignment. Replacing “White, non-Hispanic” with “White,” for example, would broaden the claim beyond the source category.
Category evidence: official November 2023 tabulation code, lines 44–45, PTDTRACE race recode followed by PEHSPNON Hispanic-origin reassignment. Retained group definitions.
Other / multiracial and missing category inputs
Other / multiracial, non-Hispanic is a combined remainder category. It cannot supply a separate estimate for each of the race responses it contains. It must not be relabelled a multiracial-only estimate, a specific community or a uniform demographic population.
The race recode preserves the missing input code rather than automatically assigning it to Other; the separate Hispanic-origin reassignment is applied afterward. These published marginal cells do not supply a missing-origin participation rate or enough information to reclassify the respondents ourselves.
Original classification: PTDTRACE / PEHSPNON code, lines 44–45; source grouping retained, no respondent data processed.
Within-group use is not audience composition
A value near three quarters says that roughly three quarters of the internet users aged 15+ in that category were reported as using social networks. It does not say that the category accounts for three quarters of U.S. users. The six percentages have different group denominators and must not be summed to make 100%.
The table covers people who already use the internet. It cannot establish social-network use among every person in a race or Hispanic-origin group. Nor does it identify a particular platform, language, country of ancestry or a race-by-income or race-by-age intersection.
Read the source errors with the point estimates. The American Indian / Alaska Native, non-Hispanic cell has an SE of 3.0266 percentage points; the White, non-Hispanic cell has an SE of 0.2865 points. An apparent ordering of the estimates alone is not evidence of a statistically significant ordering.
The descriptive point-estimate spread is 4.0 percentage points. It describes the six reported cells at one time; it is not percent growth, a confidence interval or a cultural or causal explanation. These marginal estimates do not adjust for other demographic differences.
Percentages, individual source SEs, question and population: fixed NTIA release. Range/spread and interpretation: Social Usage analysis; no pairwise significance test or adjustment.
Follow the estimates back to the source
Exact inputs and the descriptive spread
Among the six published cells, the maximum point estimate is Other / multiracial, non-Hispanic at 79.5382%; the minimum is Asian, non-Hispanic at 75.5168%. Social Usage calculates 79.5382 − 75.5168 = 4.0214 percentage points, then rounds the difference for display. These selected extrema are a descriptive range, not a significance claim or population hierarchy.
- Find
dataset=Nov 2023,variable=socialNetworkUseranduniverse=adultInternetUserin the original Analyze Table. The retained row is 769 including the header; later files may change its position. - Read each race-group
*Propcolumn and its corresponding*PropSE. Multiply both proportions by 100. - Preserve the original category order, complete labels and source classification. Select the minimum and maximum point estimates only to reproduce the descriptive spread.
- Keep November 2023, the six-month question and the age-15+ internet-user denominator with any citation.
| Group | Observation ID | Source columns |
|---|---|---|
| White, non-Hispanic | US:2023:race:raceWhite | raceWhiteProp / raceWhitePropSE |
| Black, non-Hispanic | US:2023:race:raceBlack | raceBlackProp / raceBlackPropSE |
| Hispanic, any race | US:2023:race:raceHispanic | raceHispanicProp / raceHispanicPropSE |
| Asian, non-Hispanic | US:2023:race:raceAsian | raceAsianProp / raceAsianPropSE |
| American Indian / Alaska Native, non-Hispanic | US:2023:race:raceAmIndian | raceAmIndianProp / raceAmIndianPropSE |
| Other / multiracial, non-Hispanic | US:2023:race:raceOther | raceOtherProp / raceOtherPropSE |
Source release: us-2026-10-01-ntia-v1. Analysis: ntia-race-origin-2026-10-05-v1; derivation: ntia-2023-race-origin-point-estimate-spread. Original inputs and classification evidence are bound to the assisted review.
Question, survey methods and uncertainty
The survey sequence asks about online activity done at least occasionally in the past six months. The SOCIAL question is: “What about using social networks, such as Facebook, Twitter, or Instagram?” The examples do not supply counts for individual platforms.
One randomly selected internet user aged 15+ per household; skip the activity questions when every internet user is under 15. Proxy reporting is allowed. NTIA publishes weighted estimates and SEs from the Census Bureau Current Population Survey supplement; Social Usage uses its aggregates.
No confidence interval, SE or significance test is calculated for the spread. The marginal cells do not provide the full joint sampling information for such an inference. Source sampling errors also do not describe every possible reporting, proxy, imputation, nonresponse or other nonsampling error.
November 2023 technical documentation, PDF page 148 / Attachment 8, questionnaire page 6 (USEINT / SOCIAL); fieldwork on PDF page 7. Source table code. Classification code retained from 1 October 2026 (UTC).
Separate dates, assisted review and reuse
- Survey fieldwork
- 12–18 November 2023
- Source-table publication
- 6 June 2024
- Retained source retrieval
- 1 October 2026 (UTC)
- Analysis checked
- 5 October 2026 · Assisted evidence, classification and calculation review
This report reuses an immutable reviewed source and retained official code. It is not a new source fetch, a 2026 usage statistic, a trend or an independent human editorial review.
Existing fixed exports preserve NTIA/Census credit, original population, period, errors and version. Reuse covers the selected federal aggregates and original Social Usage presentation under the recorded rights basis; no copied source graphic, agency logo or individual response is distributed.
U.S. federal statistical work; 17 U.S.C. § 105 · Sources and rights. Source: National Telecommunications and Information Administration (NTIA), Internet Use Survey, November 2023; U.S. Census Bureau Current Population Survey. Selection and presentation by SocialUsage; no agency endorsement implied.
Inspect the fixed data
Use the fixed version when citing the figures or reusing a permitted export. Other demographic dimensions are separate views.