Social Usage analysis of NTIA / U.S. Census Bureau
Social-network use by reported disability status
Two reported-status groups. What the comparison measures—and what it leaves unanswered.
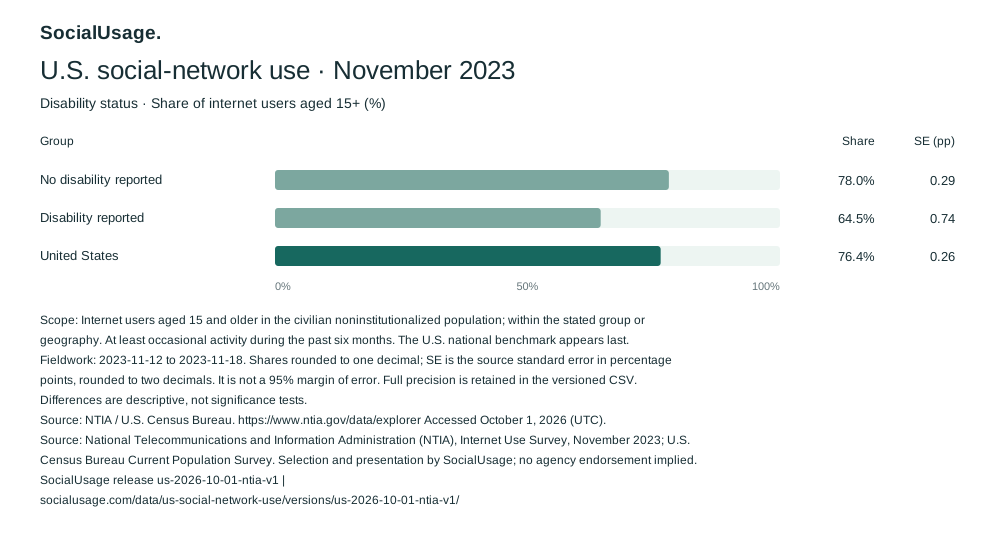
of U.S. internet users aged 15+ with disability reported used online social networks, compared with 78.0% among those with none reported—a descriptive difference of 13.5 percentage points.
United States · Internet users aged 15+ within each status group · November 2023 · At least occasional activity in the prior six months
Source: NTIA Internet Use Survey, administered by the U.S. Census Bureau. Percentages are NTIA's; the subtraction is Social Usage's analysis. These figures do not measure all people with disabilities or establish a cause for the difference.
Participation within each internet-user group
Both groups answer the same social-network question in the same survey period. Every percentage has its own within-group denominator.
Source: NTIA Analyze Table, Nov 2023 / socialNetworkUser / adultInternetUser; disabilityNoProp and disabilityYesProp. Labels round to one decimal. Original precision and source standard errors are in the table.
Read the data and source standard errors
| Source group | Share (%) | Standard error (pp) | Source flags |
|---|---|---|---|
| No disability reported | 77.9962 | 0.2861 | None recorded |
| Disability reported | 64.4960 | 0.7351 | None recorded |
Source: NTIA aggregate CSV, retained row 769 including the header; matching disabilityNoPropSE / disabilityYesPropSE columns. Proportions and their SEs are multiplied by 100. The source errors are not 95% margins or a standard error for the gap.
The separately published national estimate is 76.4%, source SE 0.2645 pp. It is weighted nationally, not an average of these two percentages. Fixed source and definition →
What “disability reported” means here
A yes response to any one of the six questions identifies disability in this CPS screen. The source's two groups retain that survey classification; they do not identify a medical diagnosis, a specific condition or benefit eligibility.
Definition: Bureau of Labor Statistics, CPS disability FAQ, question 1. NTIA classification: November 2023 tabulation code, PRDISFLG recode.
See the six difficulty areas
These are paraphrases of the CPS screen, preserving its conditions. They are not six social-network-use estimates.
- Deafness or serious difficulty hearing.
- Blindness or serious difficulty seeing, including while wearing glasses.
- Serious difficulty concentrating, remembering or making decisions because of a physical, mental or emotional condition.
- Serious difficulty walking or climbing stairs.
- Difficulty dressing or bathing.
- Difficulty doing errands alone because of a physical, mental or emotional condition.
Original wording: BLS disability FAQ, question 1. These questions cover household members aged 15+. BLS labor-force tables generally start at age 16; this NTIA activity analysis keeps its own age-15+ internet-user scope.
These questions do not reliably identify specific diagnoses or every person with a disability. “No disability reported” therefore should not be read as a clinical assessment that someone has no disability. Household reporting and the screen's coverage affect how the categories should be interpreted.
BLS FAQ, question 4 explains the specific-condition limitation; question 6 separates this measure from Social Security disability status.
A descriptive gap, with important limits
The 13.5-percentage-point difference describes social-network participation among people who already use the internet. It cannot answer what share of all people with disabilities uses social networks, because people who do not use the internet are outside both denominators.
The published cells do not adjust for age, income or other characteristics that can differ between groups. They do not identify why the percentages differ, measure a platform's accessibility or show whether any intervention would change participation. An accessibility assessment would require its own evidence about tasks, barriers and experiences.
Source sampling errors are retained for each percentage. We calculate no significance test, gap standard error or confidence interval. The marginal cells alone do not supply full covariance information for a variance calculation of the difference; reporting, nonresponse, imputation and other nonsampling errors also remain possible.
No disability-by-age, disability-by-state or disability-by-platform intersection is supplied here. These two November 2023 estimates cannot establish a historical trend or a specific-condition participation rate.
Scope, question and published cells: fixed NTIA release. Screening limits: BLS CPS FAQ. Interpretation and subtraction are Social Usage analysis, not a source-reported causal or significance finding.
Reproduce the comparison
Exact inputs, formula and rounding
77.9962 − 64.4960 = 13.5002 percentage points. Subtract full-precision source percentages before rounding. The result is a difference between groups at one time, not percent growth.
- Find
Nov 2023 / socialNetworkUser / adultInternetUserin the NTIA Analyze Table CSV. Retained row 769 includes the header; later row positions may change. - Read
disabilityNoPropanddisabilityYesProp; multiply each by 100. Matching*PropSEcolumns give source SEs, also multiplied by 100. - Subtract the disability-reported share from the no-disability-reported share. Keep the original categories, internet-user denominator, question window and source errors.
| Group | Observation ID | Source columns |
|---|---|---|
| No disability reported | US:2023:disability:disabilityNo | disabilityNoProp / disabilityNoPropSE |
| Disability reported | US:2023:disability:disabilityYes | disabilityYesProp / disabilityYesPropSE |
Fixed source release: us-2026-10-01-ntia-v1. Analysis: ntia-disability-2026-10-05-v1; derivation: ntia-2023-disability-reported-gap. Exact input objects, formula, category evidence and methodology facts are bound to the assisted analysis review.
Source classification, question and selection
The original NTIA code maps PRDISFLG=2 to the no-disability category, PRDISFLG=1 to the disability category, and -1 to missing. Missing is not treated as no disability. These percentages measure participation within each category, not how common disability is.
The activity sequence asks about things done online at least occasionally during the past six months. Its social-network question is: “What about using social networks, such as Facebook, Twitter, or Instagram?” Named examples do not provide individual-platform counts.
One randomly selected internet user aged 15+ per household; skip the activity questions when every internet user is under 15. Proxy responses are allowed. NTIA publishes weighted Census Bureau Current Population Survey supplement aggregates; Social Usage reads those published cells and processes no respondent data.
Official NTIA tabulation code, retained line 46 (PRDISFLG recode). November 2023 technical documentation, PDF page 148 / Attachment 8, questionnaire page 6 (USEINT / SOCIAL); fieldwork on PDF page 7. BLS FAQ, question 2, describes household reporting and retained disability responses between screening interviews.
Dates, assisted review and reuse
- Survey fieldwork
- 12–18 November 2023
- NTIA table publication
- 6 June 2024
- Retained NTIA retrieval
- 1 October 2026 (UTC)
- BLS methodology page modified
- 9 May 2025
- BLS methodology and rights checked
- 5 October 2026 (UTC)
- Analysis checked
- 5 October 2026 · Assisted evidence, screening and calculation review
NTIA's original source verification remains 1 October 2026. Its immutable release is reused without a new statistical-source fetch. BLS provides separately dated methodology context, not new participation observations. Reviewing this analysis in 2026 does not make the November 2023 figures current-year data or imply independent human editorial approval.
Selected NTIA federal aggregates and original Social Usage presentations have the recorded reuse basis. BLS methodology is paraphrased with attribution under its public-domain guidance; previously copyrighted images and its protected emblem are excluded. No source graphics, logos or respondent data are copied.
U.S. federal statistical work; 17 U.S.C. § 105 · BLS copyright information · Sources and rights. Source: National Telecommunications and Information Administration (NTIA), Internet Use Survey, November 2023; U.S. Census Bureau Current Population Survey. Selection and presentation by SocialUsage; no agency endorsement implied.
Inspect or reuse the source data
Fixed attributed exports preserve the source release, scope, original period and uncertainty. Other supported dimensions are separate views.