Demographics · United States
How does social media use differ by age?
Younger and older U.S. adults report different levels of platform use. Here are three comparisons from the same survey.
Data through 18 June 2025
In Pew Research Center’s 2025 survey, 80% of U.S. adults aged 18–29 said they ever used Instagram, compared with 19% of those aged 65+.
U.S. adults within each age group · Self-reported ever use · February 5–June 18, 2025
Source: Pew Research Center, Social Media Fact Sheet, “Who uses each social media platform?” AGE table. The denominator includes non-internet users.
Two age groups, three platforms
Percent of all U.S. adults in each age band who report ever using the platform. These are selected comparisons, not the complete survey table.
Source: Pew Research Center, 2025 U.S. adult survey; fieldwork February 5–June 18. Ever use, including occasional use; all adults in each age group. Published whole-percentage estimates.
View the accessible data table
| Platform | Ages 18–29 | Ages 65+ |
|---|---|---|
| 80% | 19% | |
| YouTube | 95% | 64% |
| 48% | 6% |
Exact source location: “Who uses each social media platform?” AGE table, 2025 columns for ages 18–29 and 65+.
What the comparison tells us
Both age groups report more YouTube use than Instagram or Reddit use in these selected estimates. The size of an age difference depends on the platform: a high overall level of adoption does not necessarily mean a large age gap.
Our U.S. platform age-gap analysis shows each subtraction and its inputs. These are descriptive differences between groups, not evidence that age causes a particular pattern of use.
About the comparison
Question, population and methods
The online survey wording was: “Please indicate whether or not you ever use the following websites or apps.” Online-administration wording for SMUSE. The question was asked of internet users; the cited topline rebases estimates to all adults. Paper and phone wording can differ slightly.
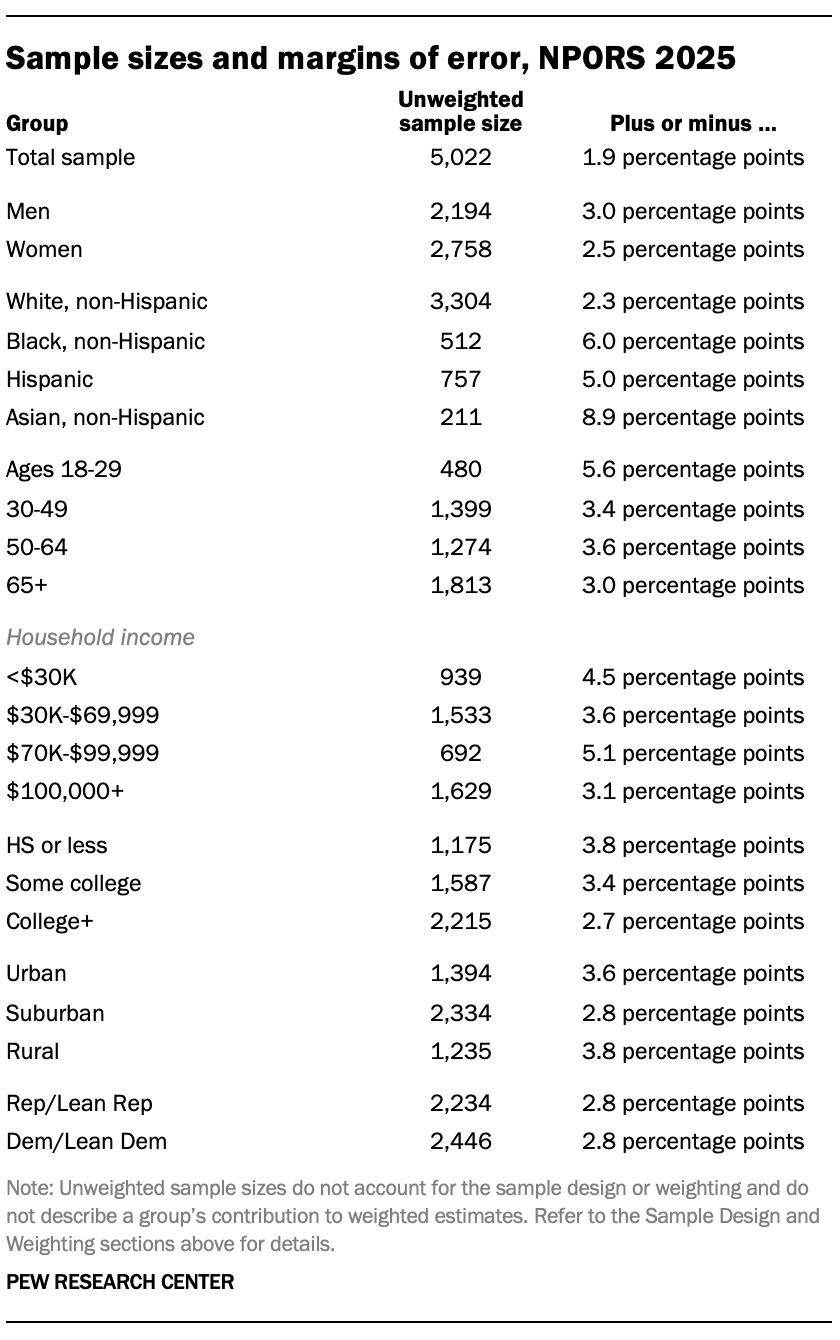
SSRS conducted Pew Research Center's 2025 National Public Opinion Reference Survey using address-based sampling and web, mail and telephone responses. Results are weighted to the U.S. adult population. The full survey included 5,022 adults; the unweighted age-group samples were 480 respondents aged 18–29 and 1,813 aged 65+.
Ever use does not establish daily or monthly activity, time spent, account numbers or global audience size. Different platforms’ percentages cannot be added to count unique social-media users.
Uncertainty and interpretation
Pew reports a 95% margin-of-error benchmark of ±1.9 percentage points for full-sample estimates at 50%. Its published age-group benchmarks are ±5.6 points for ages 18–29 and ±3.0 points for ages 65+. These are not platform-specific confidence intervals. Sampling error does not cover all possible survey error.
SocialUsage has not tested the statistical significance of these differences. This is a cross-sectional survey of different people, not a study following individuals as they age. Published whole-percentage estimates also contain rounding.
Dates, evidence review and reuse
Fieldwork: February 5–June 18, 2025. Source publication: 20 November 2025. These six age-group values were retrieved and checked on 30 September 2026. This page was revised on 1 October 2026. A later review does not change the data period.
Checks were assisted comparisons with the source table and methods; independent human editorial approval has not been recorded. We publish limited attributed excerpts and do not offer a Pew CSV, source graphic or image export.
Pew Research Center’s terms · Source and rights notes
Pew Research Center bears no responsibility for the analyses or interpretations of the data presented here. The opinions expressed herein, including any implications for policy, are those of the author and not of Pew Research Center.
Common questions
Do these figures describe teenagers?
They do not estimate teenagers as a separate group. The youngest group is aged 18–29, so it includes ages 18–19 alongside adults in their twenties. People under 18 are outside this survey population.
Where are Facebook, TikTok and the middle age groups?
This page presents six selected age estimates already covered by our platform briefs. We have not republished the full demographic table. Missing breakdowns are not zero; the original Pew fact sheet has the broader source table.
Can I use these percentages to describe all Americans?
No. Each percentage describes U.S. adults within the named age group. People under 18 are outside the denominator; adults aged 18–19 are included. The figures also measure ever use, not how often someone uses an app.
Looking beyond the United States?
Our European participation analysis and European data explorer use Eurostat’s separate measure of social-network participation. Its age bands, geography and question differ, so those percentages should not be combined with these U.S. platform estimates.